Pasetti Digital
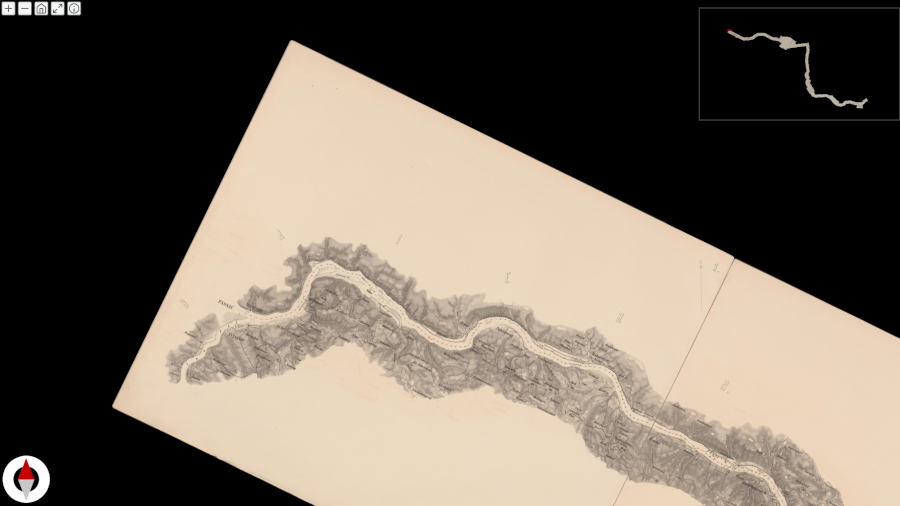
From April 29, 2021 until January 30, 2022 the Austrian National Library presents an exhibition about the river Danube, titled The Danube. A journey into the past, in the library’s State Hall. The center piece of the exhibition is an installation showing the most prominent object – the so called Pasetti map (from the years 1862–1867) of the Austrian parts of the Danube – which was graphically prepared and can be marveled at on a stretch of 44 meters. The ONB Library Labs now proudly present a digital version of the Pasetti map. In this accompanying article we explain the advantages of the application and how it was made.
Contents:
1. The Pasetti map – historical background and facts
The map, known as Pasetti map, is a cartographical status report of the river Danube and the adjoining landscapes before the intervening riverbed regulations during the second half of the 19th century (cf. Zeilinger: 2021a and Zeilinger: 2021b about the history of the map). The map shows the course of the Danube from the German–Austrian border to the Iron Gate in a scale of 1:28,800 and is based on the Franciscan survey and records of the river from before 1830. Numerous details concerning the banks, currents, water depths and traffic routes can be found on the map. Its name derives from the hydrotechnician and ministry official Florian von Pasetti (1793–1875) who was head of many construction projects for shipping lanes and ports in the Austrian empire. He was denoted editor for the project of the map edition. However, recent research has shown that the initiative for the map came from Valentin von Streffleur (1808–1870), cf. Zeilinger: 2021b. Alexander Möring (1818–1893) was responsible for drawing and compilation while Anton Dolezal was responsible for the realization in lithography. The elaborate production was published between 1862 and 1867 in 6 shipments consisting of single pages (in 1862 already 4 shipments containing sheets 1–28 were released, the fifth appeared in 1864 and the sixth in 1867). Pasetti published in 1862 his accompanying Notes on the regulation of the Danube in the Austrian empire up to the end of the year 1861 referencing the overview map of the Danube released by the royal state ministry. The map was awarded a medal at the world exhibition both 1862 in London and again 1867 in Paris. The aim of the map was not so much to give a sound basis for regulation works but rather to “create public awareness about the significance of the Danube and its systematic regulation” (Zeilinger: 2021b).
The map has been produced in grayscale lithography. The sheets of the map were printed in such a way that they could be cut out and joined into a leporello (a folded leaflet). As the curators of the Danube exhibition state, “it is remarkable that with the help of gore segments the stream is depicted correctly in its north–south course” (Petschar/Zeilinger: 2021, 11). Consequently, with corresponding handling of the gores, the map extends not only horizontally but also vertically.
The map department at the Austrian National Library holds two copies of this map in grayscale lithography. One Copy (signature KAR FKB 281-7) consists of shipments I–V that were joined manually (i.e., the rectangular sections and gore segments have been cut out and joined together with glue). The other copy (KAR AB 356(9)) contains all sheets of shipments I–VI as single leaflets not further manipulated. In the same collection a copy of a previous version from 1857, once part of the imperial private library (fideicommissum library) can be found, which was manually colored and dedicated to the emperor Franz Joseph (signature KAR FKB 279-3). All copies have been digitized and can be accessed via ONB Digital (see KAR FKB 279-3, KAR FKB 281-7 and KAR AB 356(9)).
During the graphical editing process (the result of which can be seen in the exhibtion as well as the accompanying catalogue on pages 164–201) the parts from the variants were joined, cut and smoothed out, and enlarged by 20 percent for the print at the exhibit. If these segments were to be joined horizontally they would stretch over 36 meters (while the exhibit in the state hall stretches over 44 meters due to the enlargement). In the mere horizontal adjustment white spaces remained between the rectangular segments and the triangular gore segments. The total extent of the map can be surmised from the overview sheet (skeleton for the map of the Danube stream), see figure 2.

2. Digital Pasetti map at the ONB Labs
At the ONB Library Labs we have now digitally joined together the sheets of the map in the context of our experiments on image feature recognition. We assumed it would be possible through automatic recognition of characteristic image features to achieve better matching of segments than by manually stitching together the segment outlines. It was our goal to create a navigable representation of the Pasetti map in high resolution, topographically as accurate as possible, extending horizontally and vertically as seen on the overview page. “Navigable” for us means that the map can be rotated in the compass directions as well as zoomed in and out of. In the next section we give more details on the technical implementation of this application. Additionally, according to our guidelines, we disclose the data and tools used during the development process. This way, the Pasetti map is freely available for further work and extensions.
“The map of the Danube stream is still in use today – despite certain shortcomings concerning the precision and positional accuracy. It is consulted for questions about reconstructing the historical Danube or as part of ecological restoration and dismantling plans” (Zeilinger: 2021a, 159). It would therefore be desirable to have a georeferenced version of the map, which would definitely be a big effort, especially since the allocation of historical place and field names is not trivial. By presenting the digital Pasetti map, the Labs team wants to provide a basis for such an extension.
3. Methods
In this section we want to give insights into the methods and techniques used during the development of the digital Pasetti map. The code for stitching together the image files was written in Python, while the embedding of the viewer was written in JavaScript and HTML. We use the programming library OpenCV, which contains many algorithms for image editing. Furthermore, this choice complies with the Labs mission statement to use only open source software.
Recognizing and describing image features
We use algorithms that are already implemented in OpenCV for recognizing and describing image features. To illustrate what exactly “good” image features are take a look at the following schematic image:

The area inside the red rectangle is hard to find since by moving around the red rectangle inside the blue image its content does not change. The dark blue rectangle on the other hand lies at an edge and a shift up or down causes a change in its content. However, it can be moved left or right without change. Finally we look at the green rectangle in the upper right corner of the image. Any kind of movement will change its content and thus its position can be determined uniquely. On this image, consequently, the corners of the light blue rectangle are “good” image features. We refer to the documentation of OpenCV on feature detection and description for more details.
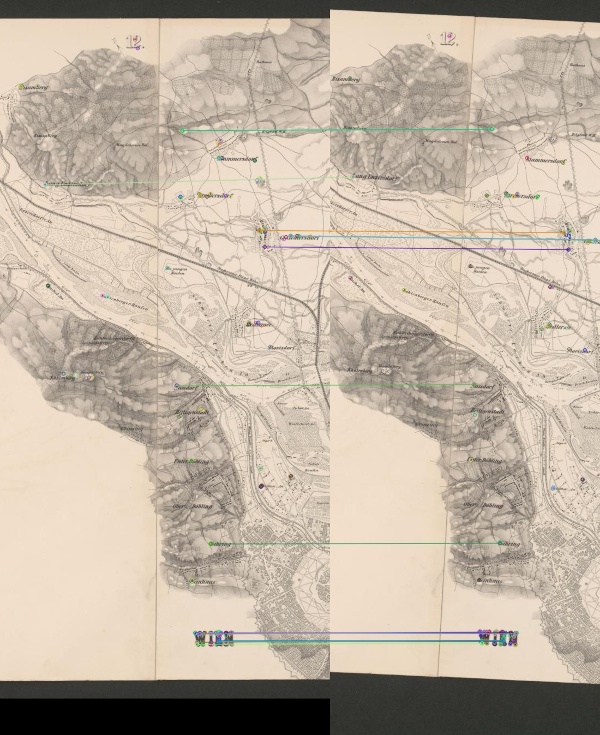
In the following figure we have marked image features of two consecutive scanned images of the Pasetti map. Based on the descriptors for each feature we have connected the most probable matches with lines. Looking at the lines on the lettering “Wien”, it is apparent how important corners and areas of high contrast are for image feature recognition.
Comparison of algorithms
Many algorithms for image feature recognition and description are implemented in OpenCV, with varying degrees of success for our use case: Some images with overlap were not recognized as matches or even wrongly matched with other images, as well as correct matching of the overall image but incorrect matching with respect to the coordinates, up to the desired correct match of images together with exact coordinates. Therefore, we have compared five of those algorithms (AKAZE, BRISK, KAZE, ORB, SIFT) based on the confidence score that they return. See the following graph for an overview:
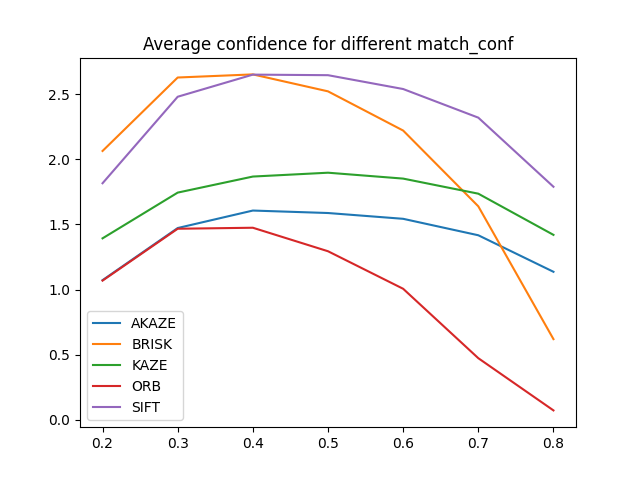
Our decision was made in favor of SIFT (scale-invariant feature transform) as it not only had a good average confidence score but it also (in contrary to ORB) identified all those images as matches which had overlap.
Determination of coordinates
From the so called homography matrix (which is returned by the algorithm) we extracted the angle, scale and shift (in x and y direction) of two images relative to each other. This was then converted to absolute coordinates relative to a fixed point (in our case the first image). Here is an excerpt of the JSON file that contains all coordinates:
0: {'src_name': '10.jpg', 'src_shape': [4578, 3150], 'dst_name': '9.jpg', 'dst_shape': [4224, 3136], 'angle': -0.08323251825809101, 'scale': 0.9987168967645754, 'x': 3624.6878848288798, 'y': -1.3621290527400665}
1: {'src_name': '11.jpg', 'src_shape': [4542, 3791], 'dst_name': '9.jpg', 'dst_shape': [4224, 3136], 'angle': -0.47064110395516434, 'scale': 0.99932858086887, 'x': 7260.183542012214, 'y': 7.561213364046086}
2: {'src_name': '12.jpg', 'src_shape': [4422, 3780], 'dst_name': '9.jpg', 'dst_shape': [4224, 3136], 'angle': -0.3934912301887074, 'scale': 0.999136761213508, 'x': 11020.240986670498, 'y': 46.98343930721032}
3: {'src_name': '13.jpg', 'src_shape': [4619, 3515], 'dst_name': '9.jpg', 'dst_shape': [4224, 3136], 'angle': -0.434097036012544, 'scale': 0.9986708756016456, 'x': 14872.032249592248, 'y': -281.46732838637723}
4: {'src_name': '14.jpg', 'src_shape': [5896, 4119], 'dst_name': '9.jpg', 'dst_shape': [4224, 3136], 'angle': 18.600059627212573, 'scale': 1.0020764862820368, 'x': 17516.73162454565, 'y': -512.0283243361719}
However, these coordinates could not be automatically generated for all images. Some parts of the map (for example in the third shipment that contains a very large area around the river banks) were first glued together and afterwards – presumably for easier storage – cut apart again. The scanned images of those parts show no overlap and we have therefore generated the connections between those components by eye. For the sixth shipment this had to be done for every sheet since it is only available as single sheets. Furthermore, we manually produced binary masks for all images such that the final panoramic map contains fewer artefacts and is less blurry. We present the example of sheet 38a from the sixth shipment where three separate gore segments were cut out from the same page:




Division into tiles
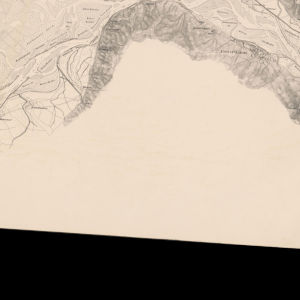
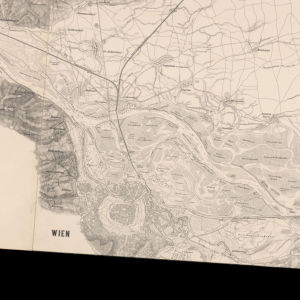
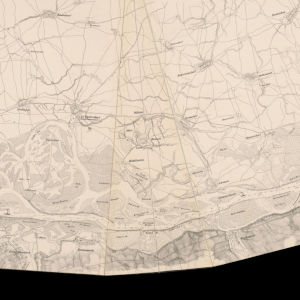
Because of the enormous size of the complete panoramic image it would make little sense to save (and view) it as a single image. As can be seen on the overview sheet (see above in Section 1) this way a lot of empty space would be created in a rectangular final image. Additionally, for the desired deployment as a web application it would be beneficial if the image could be subdivided into smaller parts. The solution we implemented is to cut out tiles from the envisioned large panoramic image and only save them if the tile is not completely black (that is, empty). After experimenting with the number (respectively the size) of the tiles we have found 3000 ⨯ 3000 pixels to be a good value. See the following figure of the map around Vienna for an example of three consecutive tiles:
Displaying the map with OpenSeadragon Viewer
For displaying the tiles we created we have found the OpenSeadragon Viewer to be very suitable. It is used to present high-resolution zoomable images in web applications. Since the viewer supports IIIF standards it fits in well with the availabe infrastructure at the Austrian National Library: The tiles are provided by a IIIF image server. We have extended the user interface of the viewer by two elements, first an info button that toggles a separate info panel and second a compass widget which can be used to rotate the map. See the following figure for a detailed view of those elements.


4. Appendix
Tools/data
| Name | Description | Link |
|---|---|---|
OpenCV | Programming library with algorithms for image editing and computer vision | |
GIMP – GNU Image Manipulation Program | Raster graphics editor used for image editing and manipulation | |
OpenSeadragon Viewer | Web-based viewer for high-resolution zoomable images | |
IIIF manifests of the scanned images | Contains metadata and direct links to the image data | |
Coordinates in JSON file format | Contains the data that was used to place the scans relative to each other |
Contribute
For the curious reader the complete code base is available in the repository for this project on our public GitLab. We are very happy when our users contribute to our projects.
A fact that is particularly interesting about this project is the existence of a partially colored variant of the map (which was published five years prior and does not extend as far, see the discussion in Section 1 and here for the IIIF manifest of the colored copy). To be able to present this version of the map in the same way as the grayscale version we are looking forward to contributions and help from the labs community!
Another interesting aspect would be to obtain a georeferenced version of the Pasetti map (with respect to a modern map) to make visible the changes in the riverbed since then.
This project was supported by the project “Digital Transformation of the Austrian Humanities”.
References
- Hans Petschar and Elisabeth Zeilinger: Einleitung. In: Die Donau. Eine Reise in die Vergangenheit. Eds. Hans Petschar, Elisabeth Zeilinger. Vienna 2021, pages 8–11.
- Elisabeth Zeilinger: Die „Pasetti-Karte“: Der Lauf der Donau von Passau bis zum Eisernen Tor. In: Die Donau. Eine Reise in die Vergangenheit. Eds. Hans Petschar, Elisabeth Zeilinger. Vienna 2021, pages 148–161.
- Elisabeth Zeilinger: Zur Urheberschaft der Pasetti-Karte. In: Research blog of the Austrian National Library, August 27, 2021, https://www.onb.ac.at/mehr/blogs/detail/zur-urheberschaft-der-pasetti-karte.
